- Register as a new user to .
- Choose a data platform to load data to.
- Navigate the UI, and create an orchestration pipeline to extract and load your data into your chosen data warehouse.
- Create a transformation pipeline to transform your data.
- Use source control to save your work.
- Publish your branch, and schedule your working pipeline to run every week.
- View a clear representation of data flow in your transformation pipeline using our lineage feature.
- If you wish to follow along using the Jira Query component, you’ll need valid login credentials to access the Atlassian portal and the Jira application. A valid account is required to authorize the Jira Query component you will be using later in the example. For more information, read the Jira authentication guide.
- While this tutorial extracts data from Jira, the foundational principles still apply if you’re connecting to other services such as Salesforce, Facebook, Shopify, and so on.
Register to Maia
Before you begin, you will need to register for a account. is a single platform that offers a wide range of services for all registered customers, and this is the only way you can access . For more information, read Registration.
- Create your profile.
- Set up your account.
- Get started.
The Designer canvas
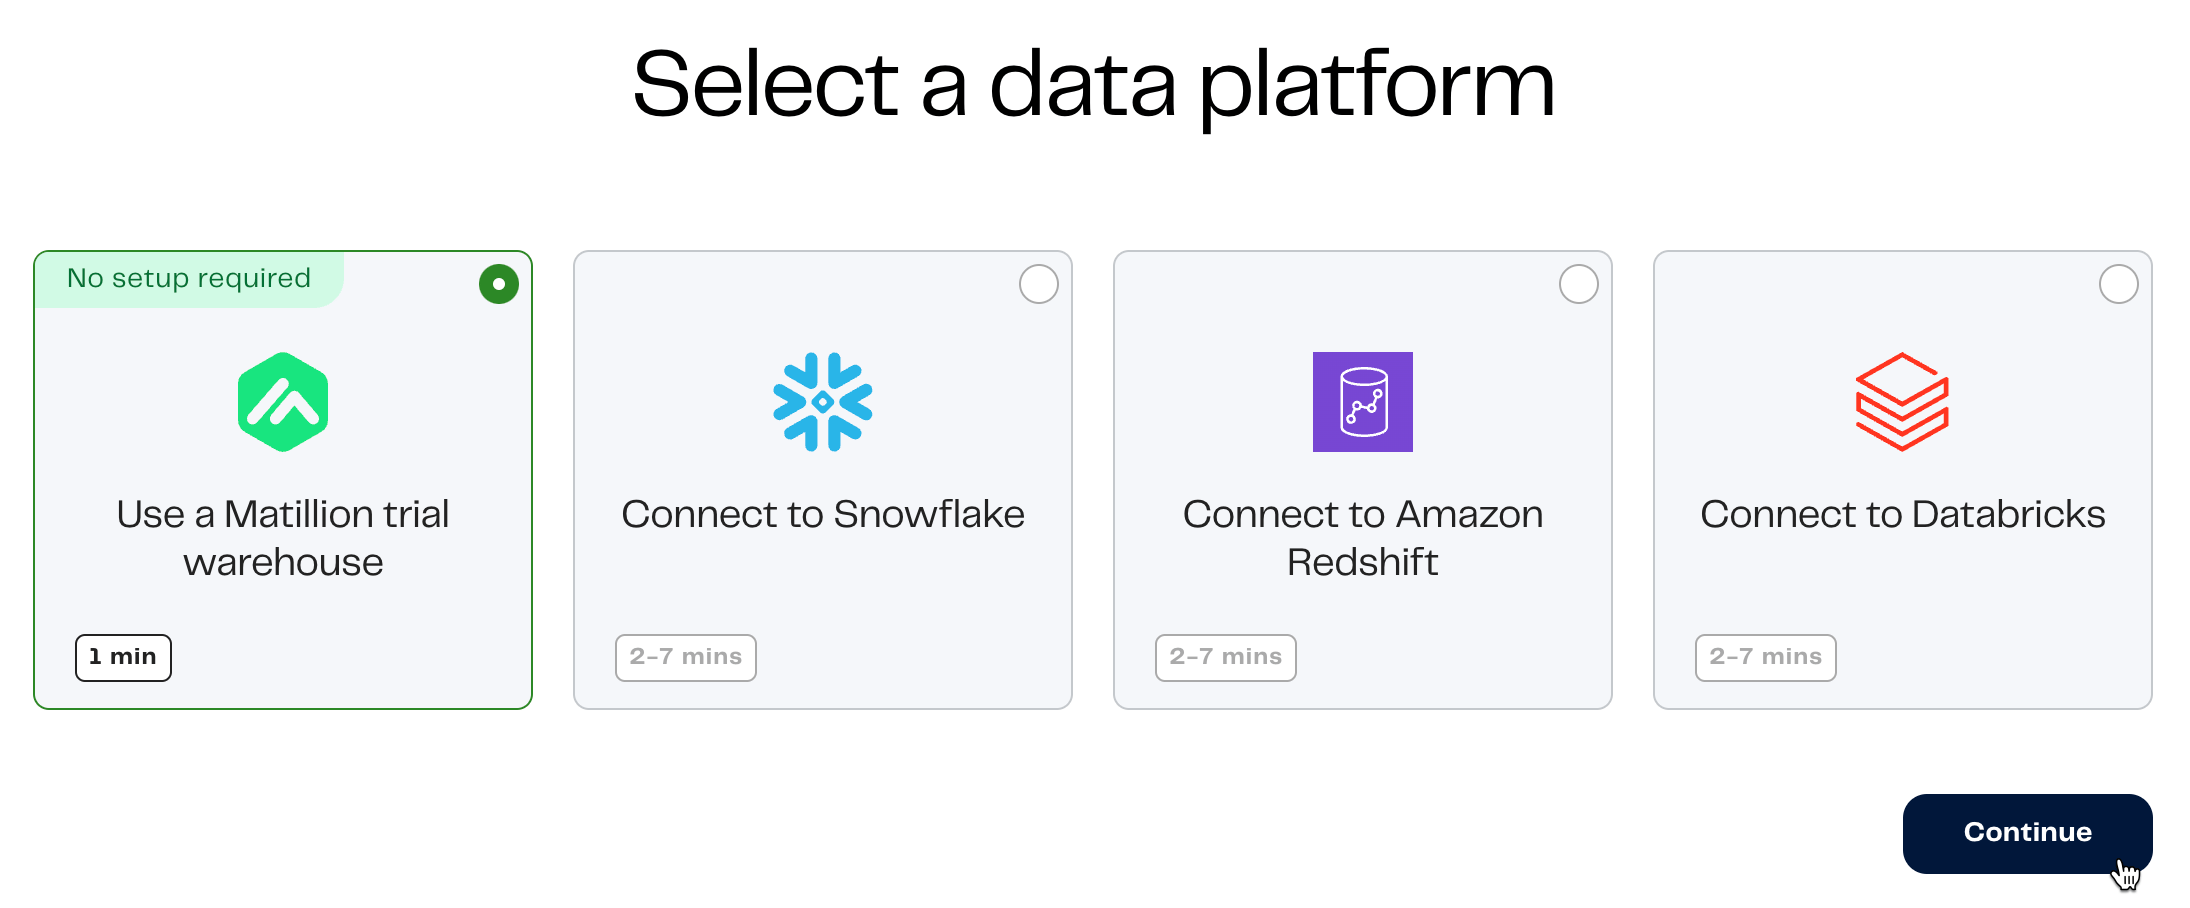
When the setup process is completed, the canvas will be displayed. A project will be waiting for you labelled My first project. For more information about the basic concepts behind what has already been set up for you—a cloud data warehouse and a project—read overview and Projects, respectively.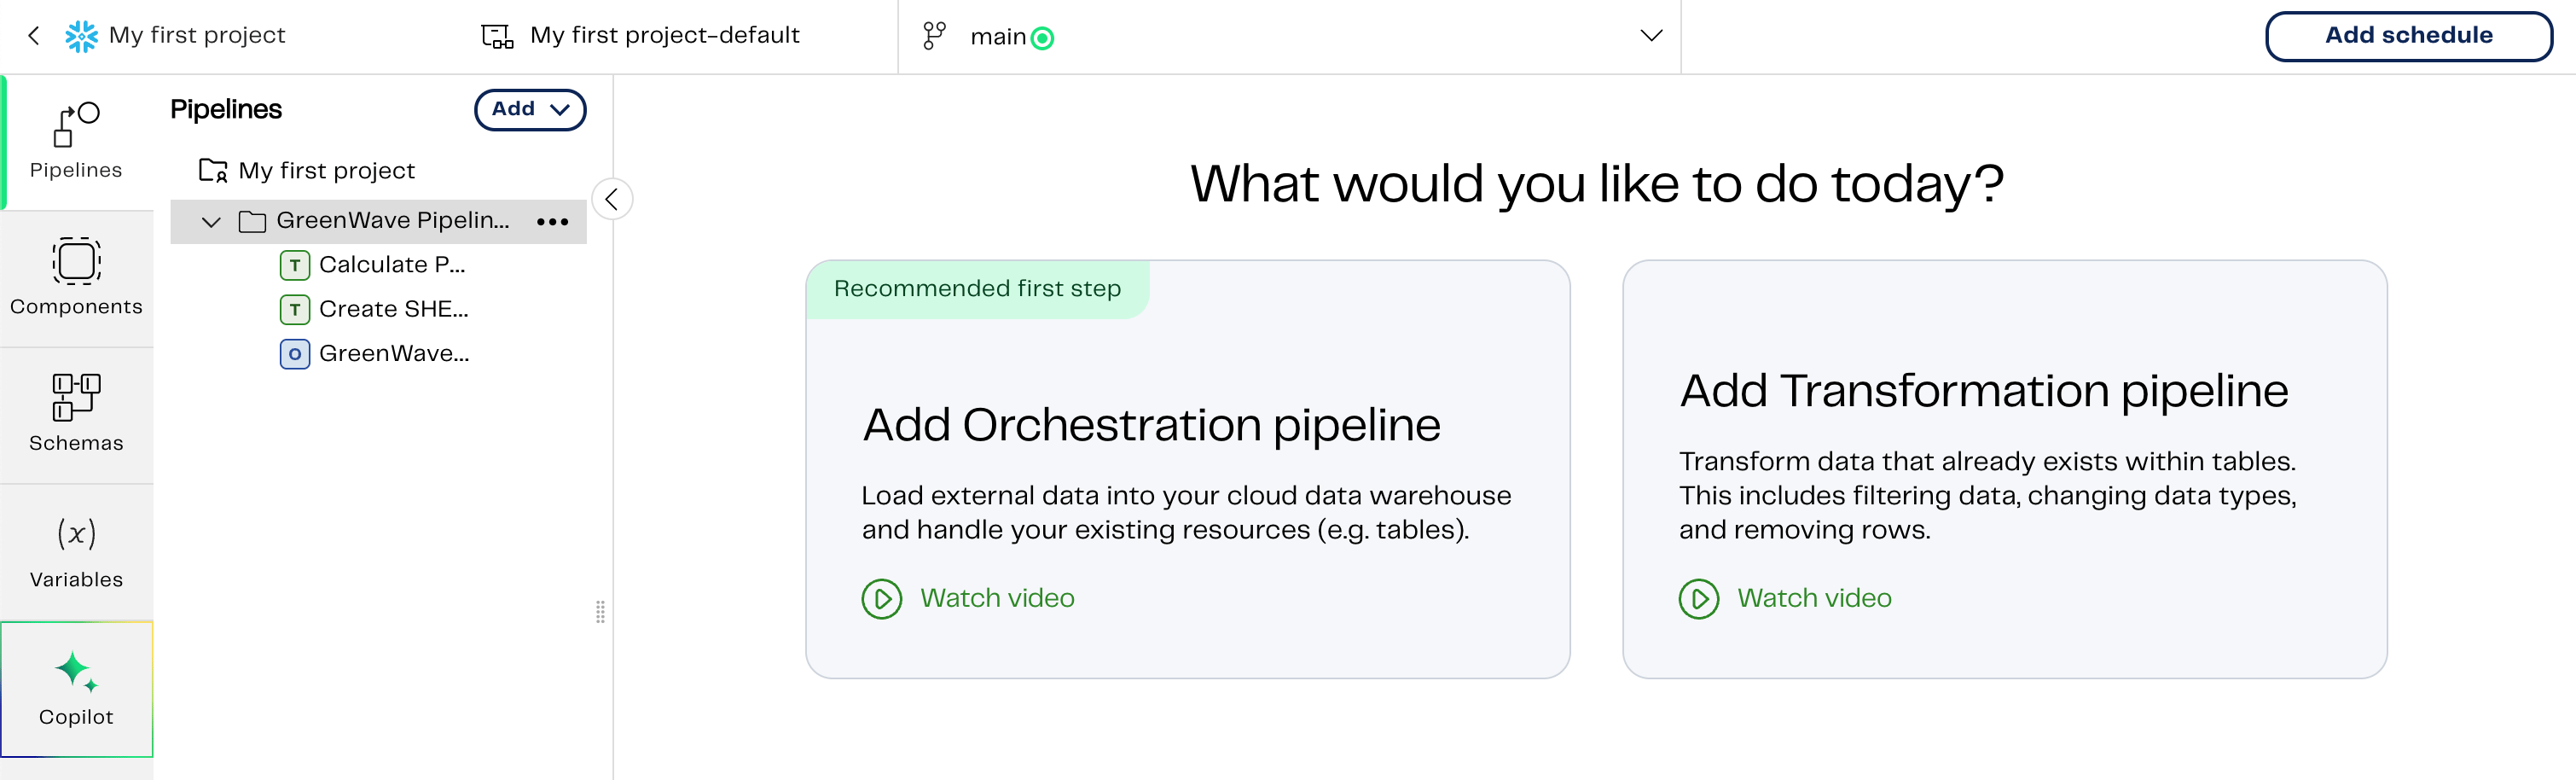
To become familiar with the UI, read UI basics.
Version control
Before we begin, at the top of the canvas in its own tab you’ll notice you are currently working on themain branch. When a project was first created for you during registration, an associated Matillion-hosted Git repository was also created, with a default branch called main.
It’s recommended that you create another branch other than
main to develop your pipelines.Create a new branch
Let’s begin by creating a new branch and making sure we Branch frommain.
- From the canvas, click My first project to return to the action menu of your project.
- In the Branches tab, click Add new branch.
- Give a unique name for your new branch.
- Choose
mainas the branch to branch from. - Select an environment. Environments are for configuring your connection to your data warehouse. An environment was already set up for you during registration, but for more information, read Environments.
- Click Create.
- You will be returned to the Branches tab. Find and click on your newly created branch to return to the canvas on your new branch.
Build an orchestration pipeline
After you have added a new branch, What would you like to do today? will be displayed. Click the Add Orchestration pipeline tile to add our first pipeline. Create an appropriate name for your new pipeline. You could call it “extract-jira-data”, and then click Add.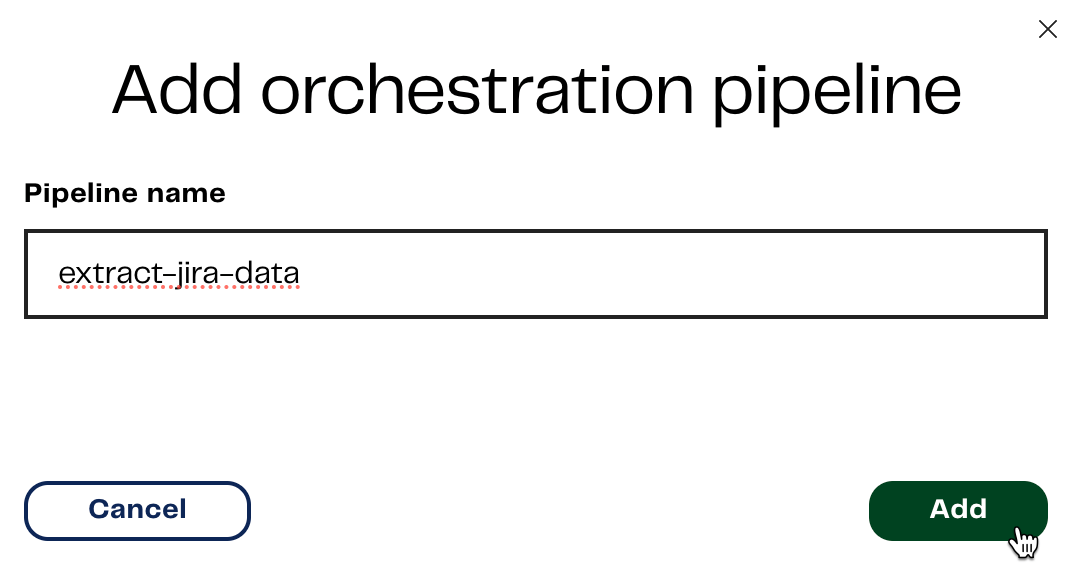
Extract and load Jira data
On your canvas, locate and click on the Start component and then click the black + symbol to open the Add component dialog. In the search bar, type “Jira”. Click Jira Query. The component will be added to the pipeline canvas with a connecting line tying your Start component to your Jira Query component. Click the Jira Query component and you’ll see the Properties panel open on the right-hand side. As the first step in configuring the Jira Query component, you’re required to authenticate to it. Choose between User/Password and User/API Token. Read the Jira authentication guide to learn how to obtain a Jira API Token. For more information about storing tokens and passwords in , read Secrets and secret definitions. Lets start to configure the component for our Snowflake data warehouse. You can obtain the component property information from the Jira Query documentation. For the purpose of this example, we want to extract epics information from the Jira database. For specific property information, refer to the following table:| Property | Value |
|---|---|
| Basic Advanced Mode | Basic |
| Data Source | Epics |
| Data Selection | BoardID, Done, Id, Key, Name, Summary |
| Target Table | Create a suitable name for the table that will hold the extracted data. |
You can leave the remainder of the properties set to their default values.
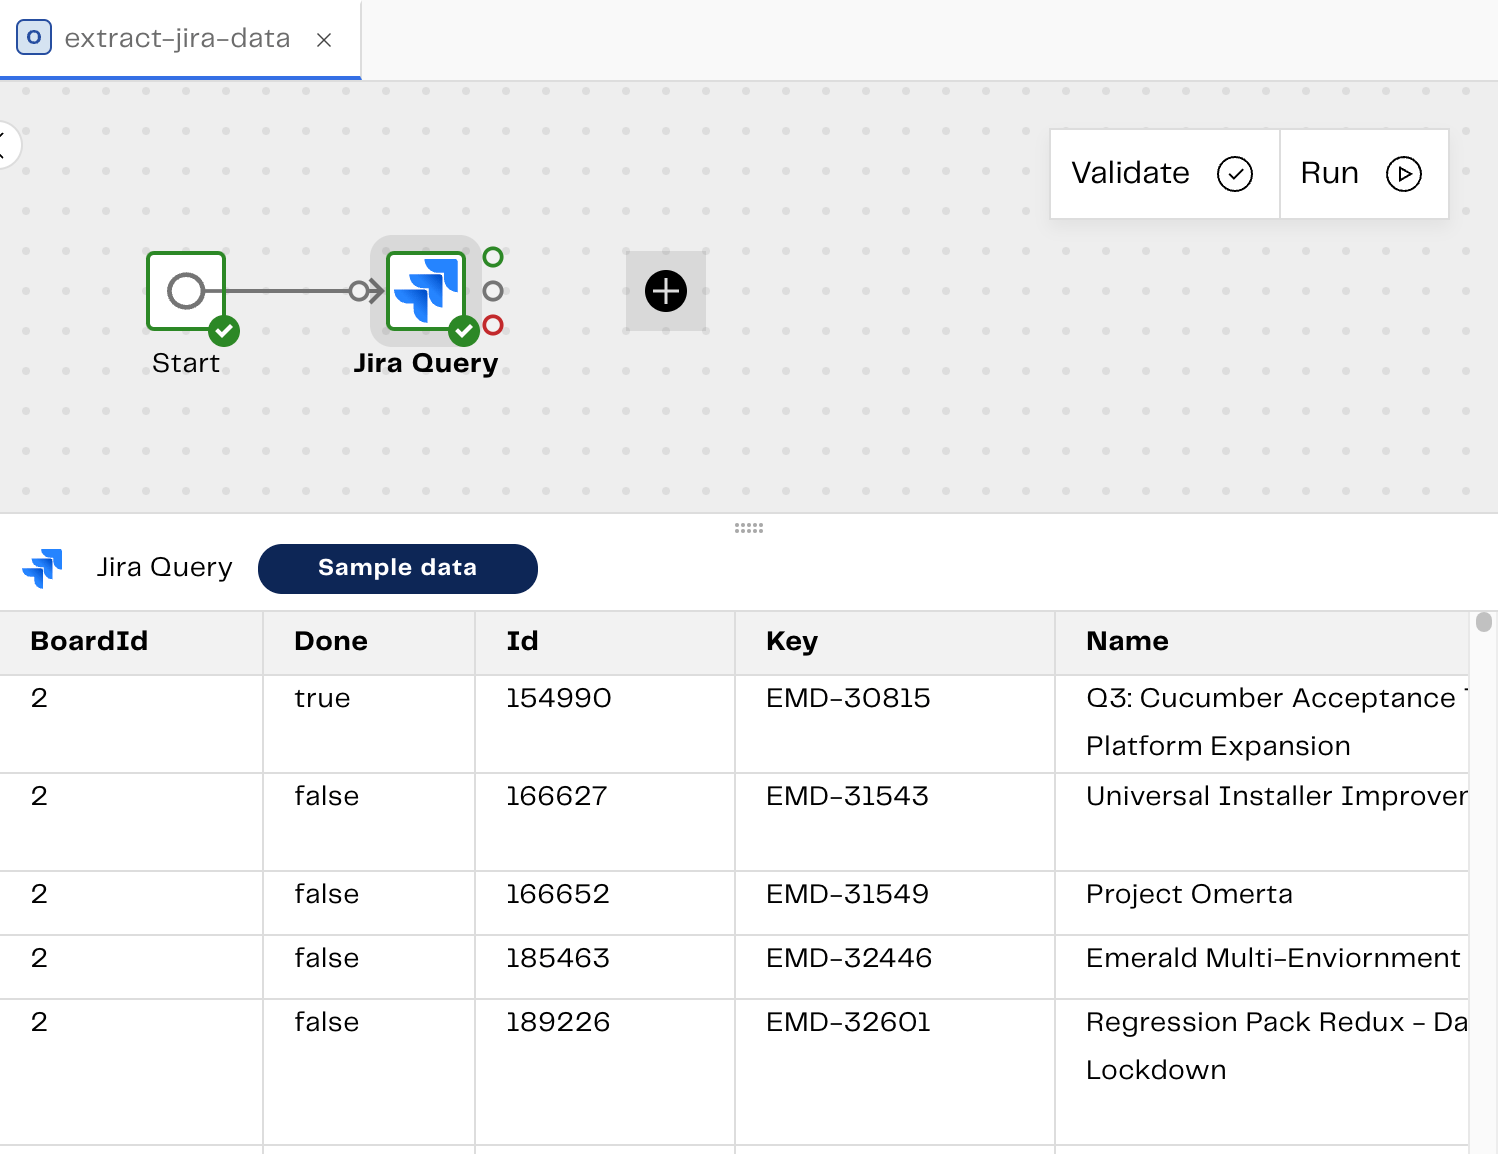
The benefit of validating and sampling your data directly from the component is that you can test your pipeline at each stage of the process without needing to complete and run it.
Build a transformation pipeline
Let’s begin by adding a transformation pipeline.- Click the Files panel at the top of the pipeline canvas.
- Click the + icon in the top right.
- Select Transformation pipeline. The Add transformation pipeline dialog will open.
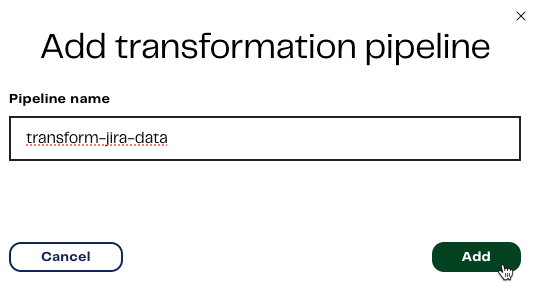
- Enter an appropriate name for your pipeline. For example, you could name it “transform-jira-data”.
-
Click Add.
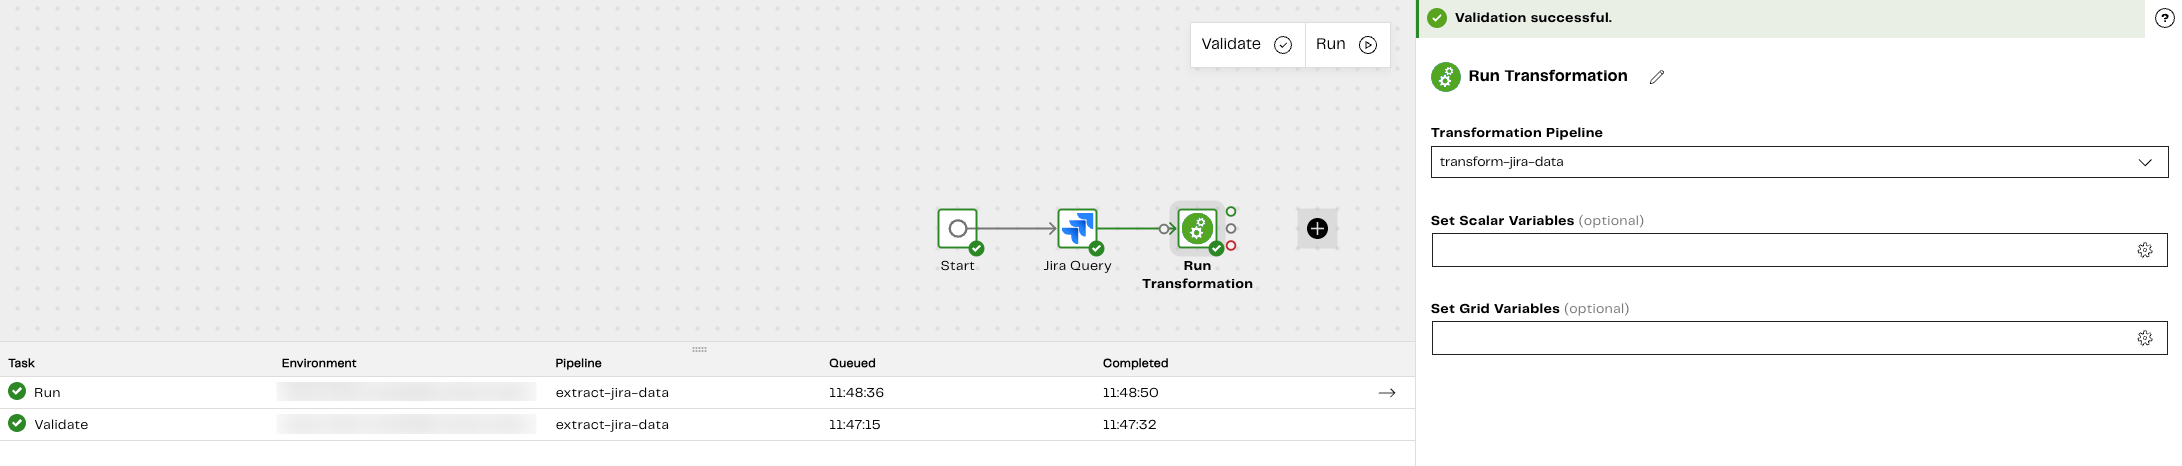
- Return to your orchestration pipeline and add the Run Transformation component.
- Use the Transformation Pipeline drop-down to select the name of your newly created transformation pipeline.
-
Validate and Run the pipeline. Adding the Run Transformation component means we can run our transformation pipeline as part of our orchestration pipeline. When you run a pipeline you can see its progress in the Task history tab. For more information, read Task history tab.
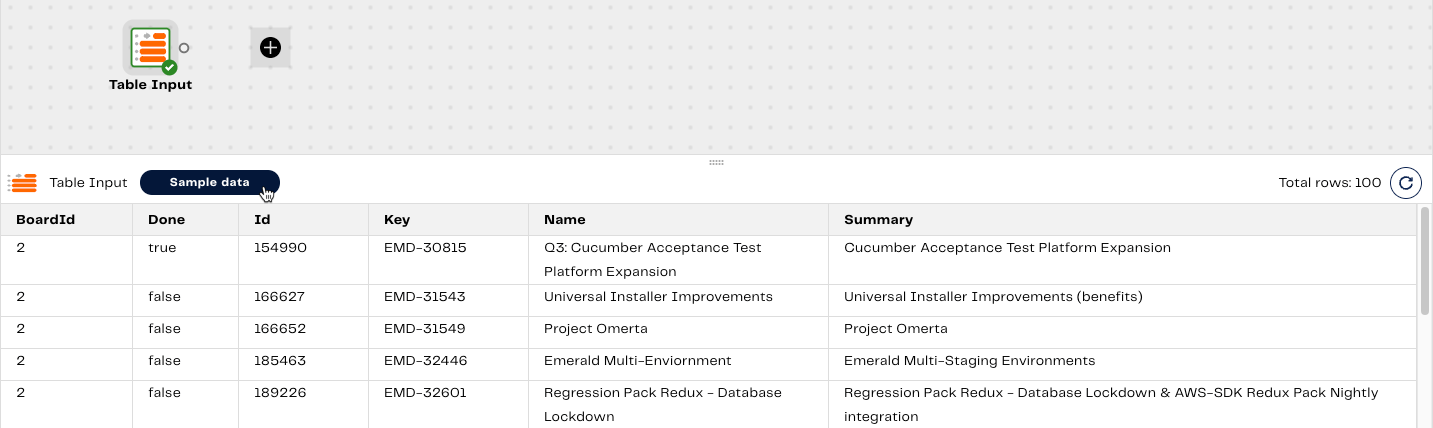
- Return to your transformation pipeline. We want to transform our Epics table data after extracting and loading it in to our orchestration pipeline earlier and transform it into something useful. To do this, add the Table Input component. For specific property information, refer to the following table:
| Property | Value |
|---|---|
| Target Table | Select the target table name you set in the Jira Query component earlier. |
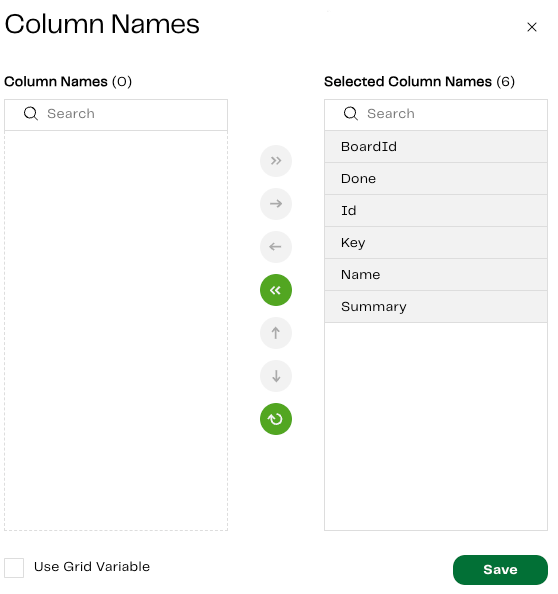
| Column Names | Select all the columns from the Epics database: BoardId, Done, Id, Key, Name, and Summary. |
You can leave the remainder of the properties set to their default values.
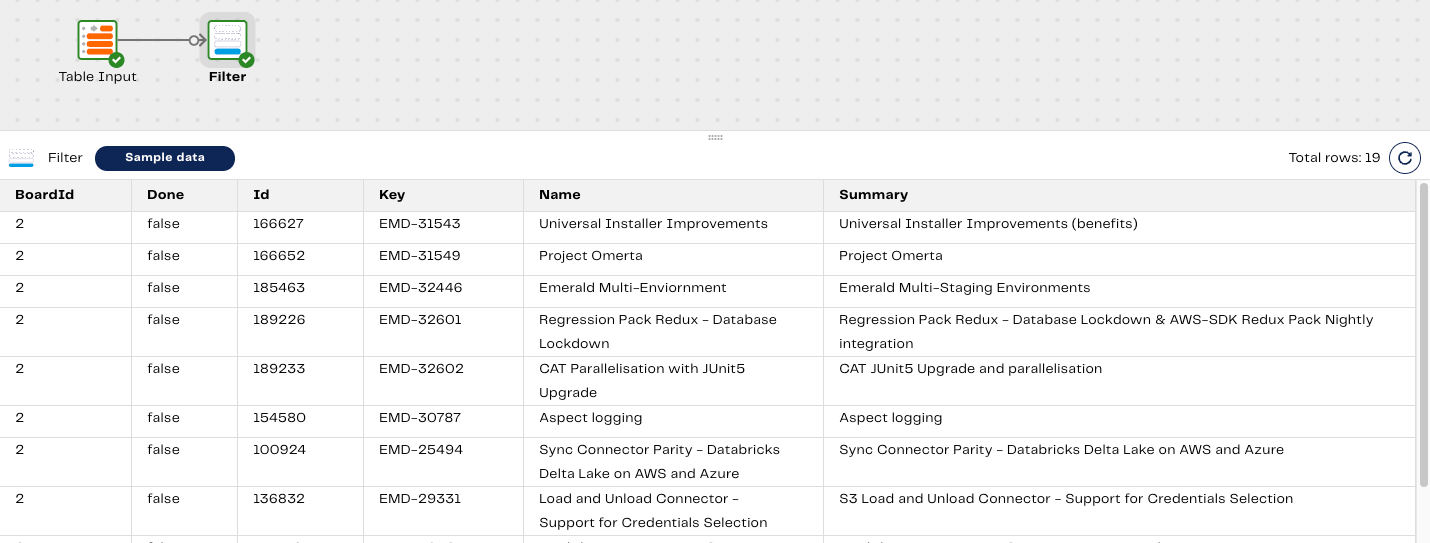
Filter the data
We now need to add a Filter component to our transformation pipeline to exclude data we don’t want to see. In this case, we will use a filter to only show Epics that are not completed, because they are in progress or have not yet been started. To do this, add the Filter component to the pipeline canvas. You can obtain the component property information from the linked Filter documentation. For specific property information, refer to the following table:| Property | Value |
|---|---|
| Filter Conditions | Set the filter to only show the Done Input Column to false. |
- Input Column: Done
- Qualifier: Is
- Comparator: Equal to
- Value: false
Done column indicates whether an Epic has been closed, i.e. True. An open Epic will therefore have False as the value, and as such, the filter will exclude all completed Epics, and only return rows where the status is False (incomplete).
You can leave the remainder of the properties set to their default values.
| Property | Value |
|---|---|
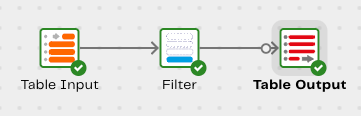
| Target Table | Select the target table name you set in the Jira Query component earlier. |
| Column Mapping | Set the Input Column and Output Column to the following: Done, Id, Name, and Summary. |
You can leave the remainder of the properties set to their default values.
main branch so that it is saved to the Matillion-hosted Git repository, and can be published for other users to see and use.
Use Git to push local changes to the main branch
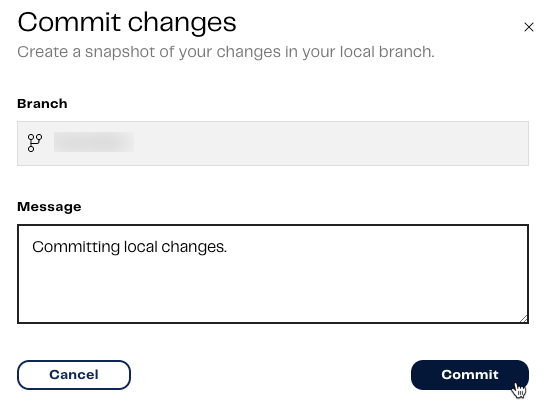
Currently, these pipelines have only been created locally in our instance of the branch we’re using. We now need to commit and push our workflow changes to the remote repository. After this has been done. The pipelines can be viewed and accessed by other users in our project when they pull remote changes. To do this, click the downward facing arrow in your current Git branch at the top of the page. The Git menu will be displayed. Click Commit changes. For more information, read Git commit.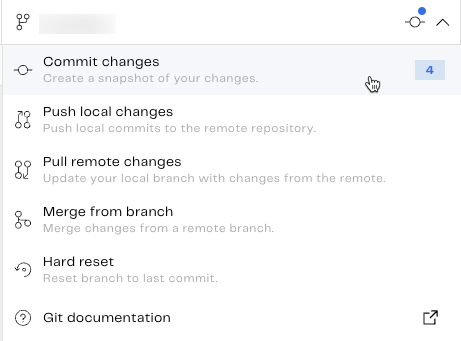
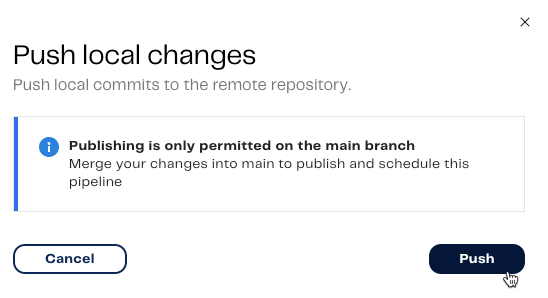
- Click Push local changes.
- Click Push. Another message will appear saying your local commits have been pushed to the remote branch. For more information, read Git push local changes.
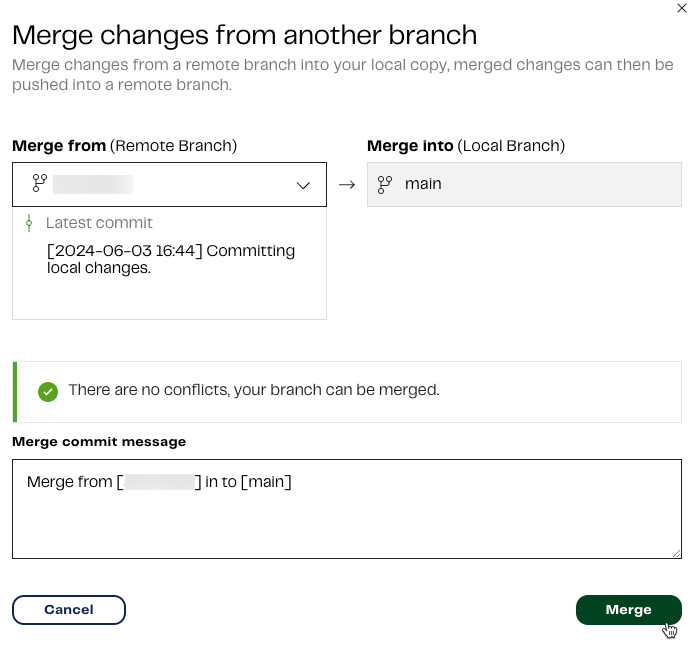
main branch. Our final step is to merge our changes from the remote development branch to the main branch. To do this:
- Click Merge from branch.
- In the Merge from (Remote Branch) drop-down, make sure you select the branch you created earlier, which has our pipeline workflow saved to it. Merge into (Local Branch) will already be set to the
mainbranch. - Click Merge. For more information, read Git merge.
main branch. This is another reason why it’s a requirement to push our changes to main once they’re finalized.
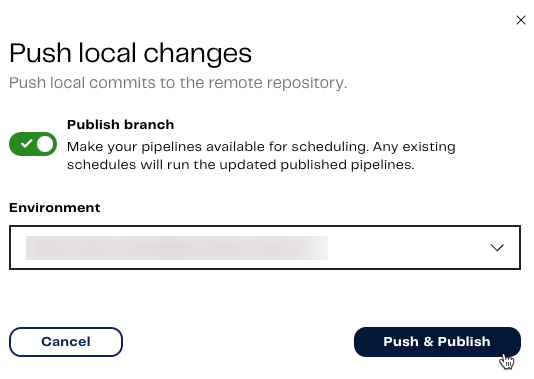
Publish a pipeline
To publish our pipelines:- Make sure you’re in the
mainbranch. - Click the name of your branch in the project bar.
- In the drop-down, click Push local changes. For more information, read Git push local changes.
- Toggle to enable Publish branch. Publishing your pipelines will make them available for scheduling, which we will be doing next.
- Select the Environment to publish to. In this case, select My first project-default.
- Click Push & Publish.
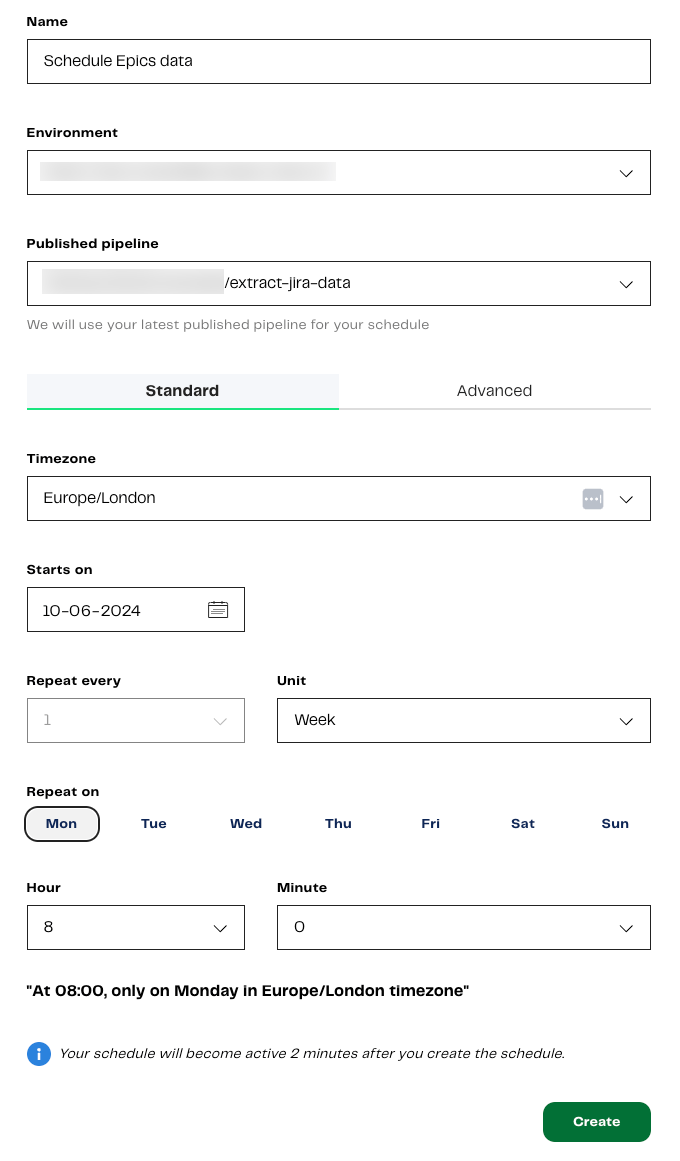
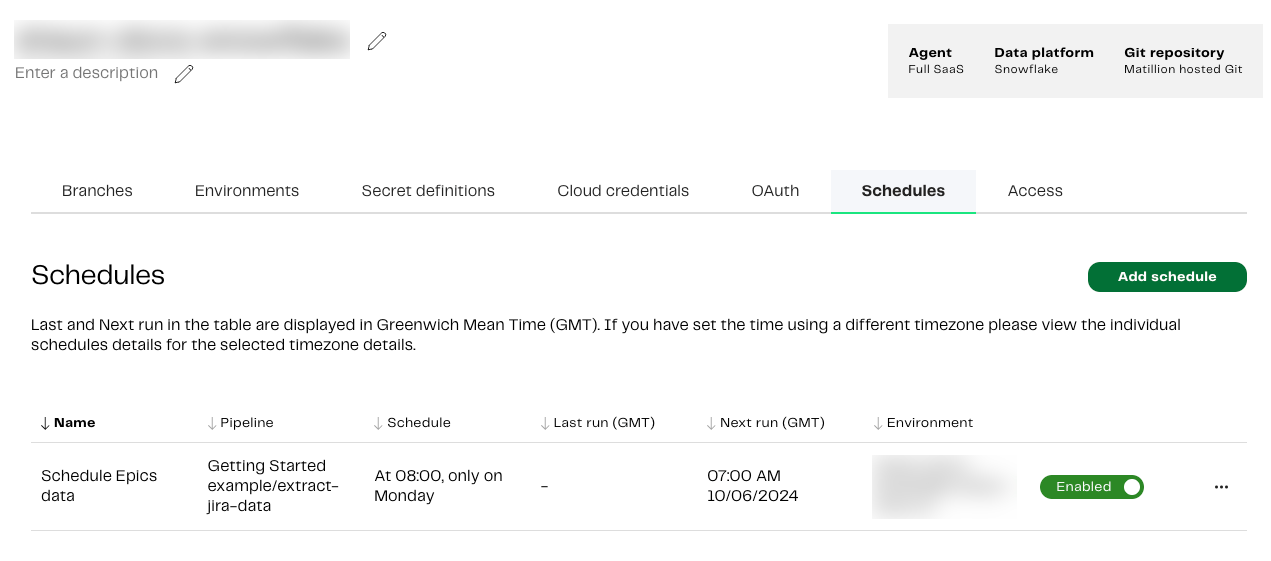
Schedule a pipeline
We now have a published pipeline workflow, and we can also run our orchestration and transformation pipelines whenever we want to. Let’s create a schedule for our orchestration pipeline to extract the new Epics data in Jira, then it’ll use the Run Transformation component to filter it. To do this, from themain branch in our pipelines, click the Add Schedule button in the top-right.
Click Schedule.
You will be taken away from the pipeline canvas, and the Create a new schedule page will be displayed. Enter the following schedule properties:
| Property | Description |
|---|---|
| Name | A unique, descriptive name for the schedule. You can call it “Schedule Epics data”. |
| Environment | Select the environment configuration that the schedule will run pipelines using. In this case, select our default Snowflake environment, My first project-default. |
| Published pipeline | Select a pipeline to run in the schedule. In this case, select our orchestration pipeline, “extract-jira-data”. |
| Timezone | Remain in the Standard tab, and choose a Timezone for the schedule to adhere to. Choose Europe/London. |
| Starts on | Select the date and time that the schedule will be enabled. This is not necessarily the time of the first schedule run. For example, if your start date and time is 1st August 2024 at 5:00pm, with a schedule set to run every day at 8:00am, your pipeline will first run at 8:00am on 2nd August 2024. |
| Repeat every | The interval between schedule runs. Select 1. |
| Unit | The units of the Repeat every interval. Options are Day (the default), Week, Hour, or Minute. Select Week. |
| Repeat on | Select the day of the week you want your schedule to run. Select Mon. |
| Hour | Select the hour and minute you want your schedule to begin. Select 8 and 0, respectively. |
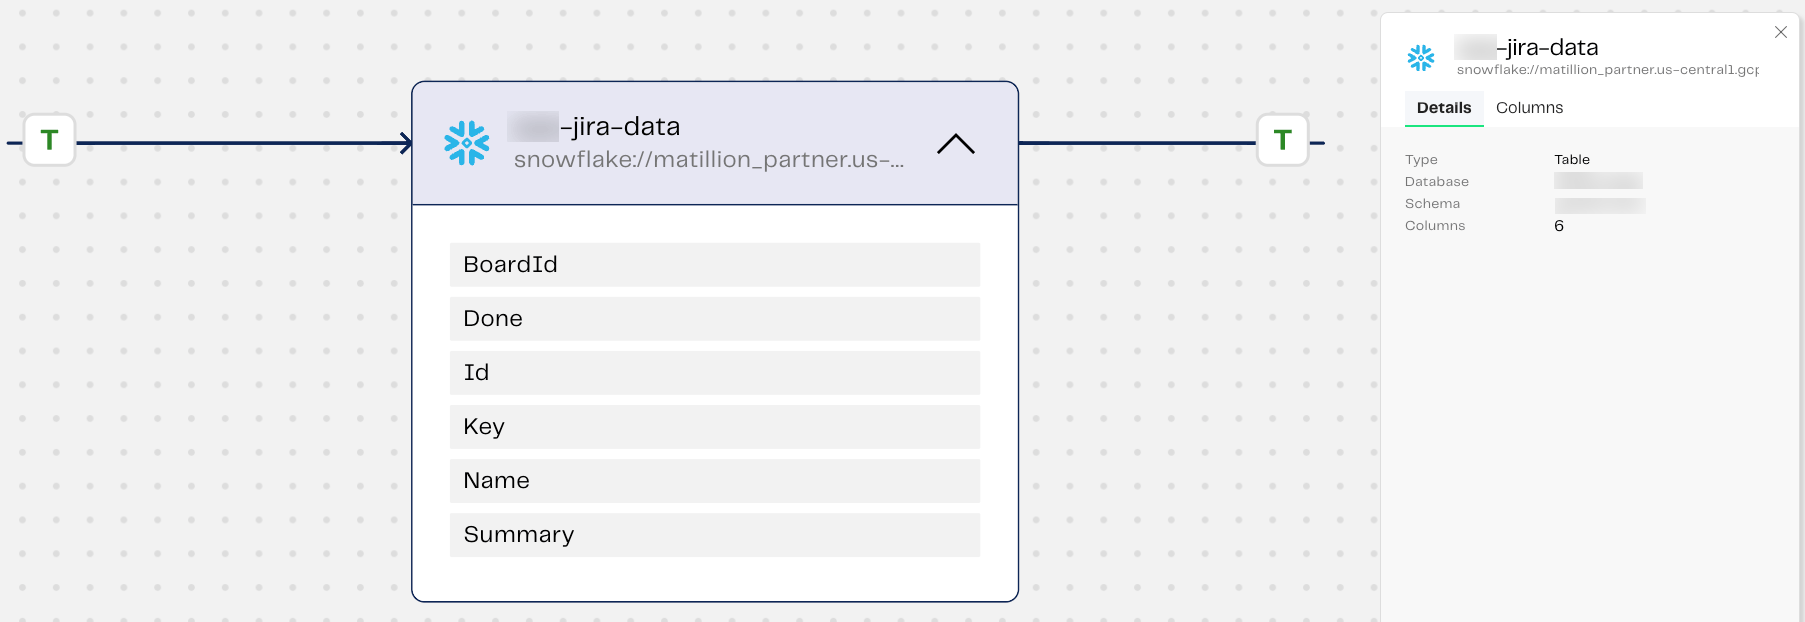
Pipeline data flow
Now we have working, published, pipelines, lets use lineage to view a clear representation of the data flow in our transformation pipeline. To access the Lineage feature, in the left navigation, click . Then, select Lineage from the menu. We can review details about our selected Jira data source, the number of columns in the Epics table we selected earlier, column names, and column types.