
Accessing pipeline runs
To view your pipeline execution history, click , then Pipeline Runs. Here, you can view a list of recent pipeline executions, along with their status (Success or Failed), and any anomaly indicators.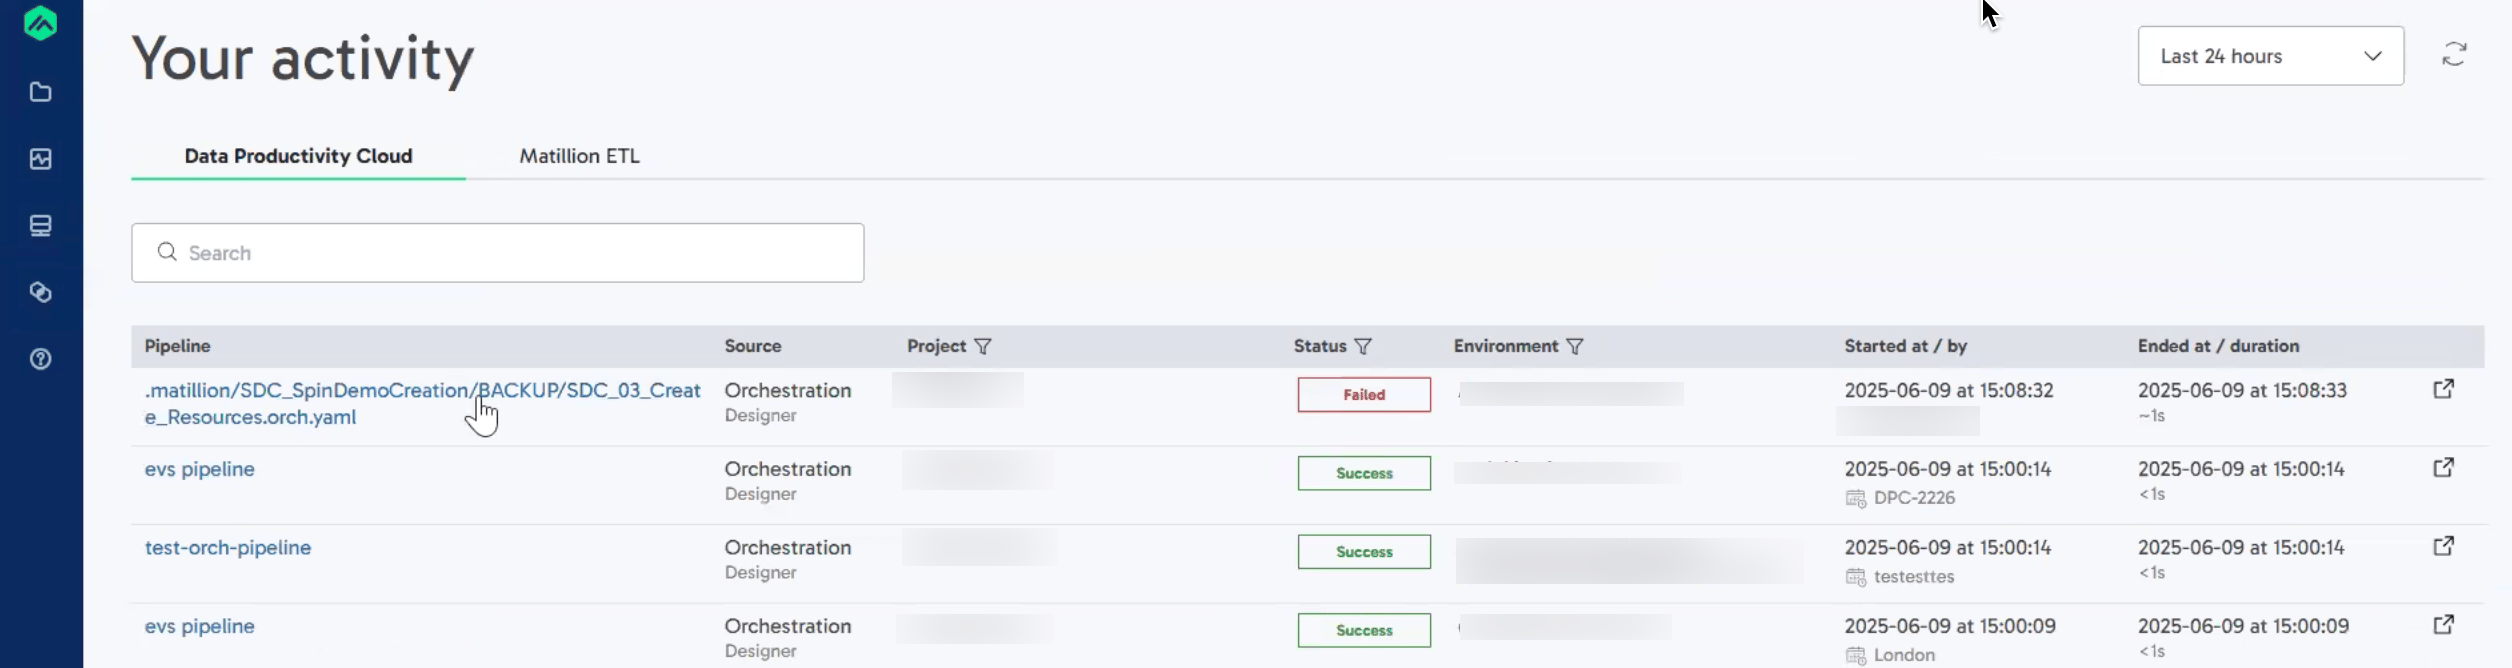
Pipeline recovery with Maia
When a scheduled or API-triggered executed pipeline run fails, generates a root cause analysis. If identifies a fix for the problem, you can then use the Fix with feature to recover your pipeline.Root cause analysis
When a pipeline fails, automatically analyzes the error and provides a context-aware root cause analysis to help you understand what went wrong. To view the root cause analysis:- In Pipeline Runs, click the name of any pipeline with a Failed status.
- On the Pipeline run details page, click See more in the Troubleshoot with Maia card.
- Analyzes failures at every level of your pipeline, including inside iterators and orchestration steps
- Captures pipeline-level failures such as specific SQL errors
- Includes warning-level runner task logs to provide context on the lead-up to the failure
- Identifies the exact cause of the error, not necessarily where it occurred
- Summarizes each issue in plain language, including a category and an indication of whether it’s fixable within your pipeline
- Suggests recommended fixes
Fix with Maia
can assist you in applying any recommended fixes identified during the root cause analysis. It uses contextual awareness of the executed pipeline’s codebase and history to apply changes accurately and efficiently. The proposed fix targets the originating component—the root cause identified during analysis—rather than the step where the error surfaced. Review the changes before committing to ensure that you are happy with the applied fix.Fix with Maia is only available for scheduled or API-triggered pipeline executions.
- Click Fix with Maia to open the dialog.
- Enter the following details to create a new branch for applying fixes to your pipeline:
- Branch Name: Provide a unique name for the new working branch where the fixes will be applied.
- Select base branch: Choose the source branch from which the new branch will be created. We recommend branching from the
mainbranch. highlight the most relevant branch as “suggested” based on your commit and publish history. You can select a different branch if required. - Select environment: Choose the environment where the new branch will be deployed. automatically select the environment in which the failure occurred by default. You can choose a different environment if required.
- Click Get started to proceed.
- Compare the changes have made against the original code.
- Complete the fix by committing the changes, pushing the local changes to the remote repository, and publishing your pipeline. For more information about using source control, read Git in .
Anomaly detection
automatically monitor your scheduled pipeline runs and flag significant deviations from expected behavior. This helps you detect potential issues before they become failures. use statistical modeling to compare each scheduled pipeline run against historical trends. When execution time falls significantly outside the expected range, flag the run as an anomaly. Anomaly detection currently provides visual indicators only—no alerts are triggered (such as email notifications). require at least 10 prior scheduled runs of the same pipeline to establish a reliable trend for anomaly detection.
Anomaly indicators
In the Pipeline Runs dashboard, anomalies are displayed with:- Red arrows (up/down) highlighting anomalies next to duration metrics
- Tooltips with details when you hover over the indicator (for example: “7.8% longer than expected based on recent runs”)
- Anomalies section listing all detected anomalies for the run

Common anomaly scenarios
| Scenario | Example | Anomaly type |
|---|---|---|
| Infrastructure performance | Load times spike due to backend slowness | Execution time higher |
| Optimization or refactoring | Code change makes execution faster than usual | Execution time lower |
| Source data changes | Upstream table has significantly more data | Execution time higher |
| Schema or configuration updates | Business logic change affects processing | Execution time varies |