
The Designer canvas
When you create or open a pipeline in , you’ll see the canvas–the dotted area containing the components that make up your pipeline. The name of the pipeline you’re currently working on is shown in a tab above the canvas. You can have multiple pipelines open at once, and switch between them using these tabs. Drag and drop tabs to reorder them, or click the X icon on a tab to close it. Click and drag any empty space on the canvas to move around. The drop-down in the bottom right of the canvas shows your current zoom level and allows you to adjust your view of the canvas using the following options:- Click the + and - icons to zoom in or out by 25%.
- Click Fit all to either zoom in to 100% if all components are visible, or zoom out far enough that all components are visible.
- Click Format layout to let adjust the layout of your pipeline so that components are arranged neatly.
A default session times out after 24 hours of inactivity.
Designer features
In , there are a number of icons, panels, tabs, and toolbars around the canvas that you can use to perform a range of actions when working on your pipelines. Click and drag the edge of any panel or tab around the canvas to adjust its size to show as much information as you choose. The width of the panels on the left of the canvas and the component properties panel on the right will be saved the next time you close and re-open . The tabs at the bottom of the canvas will open to your chosen height during your current session, but return to their default height the next time you close and re-open . The list below explains what each of these elements does, and the image below shows where they are located in . Please note, this image may occasionally not be fully up-to-date as we make continuous improvements to .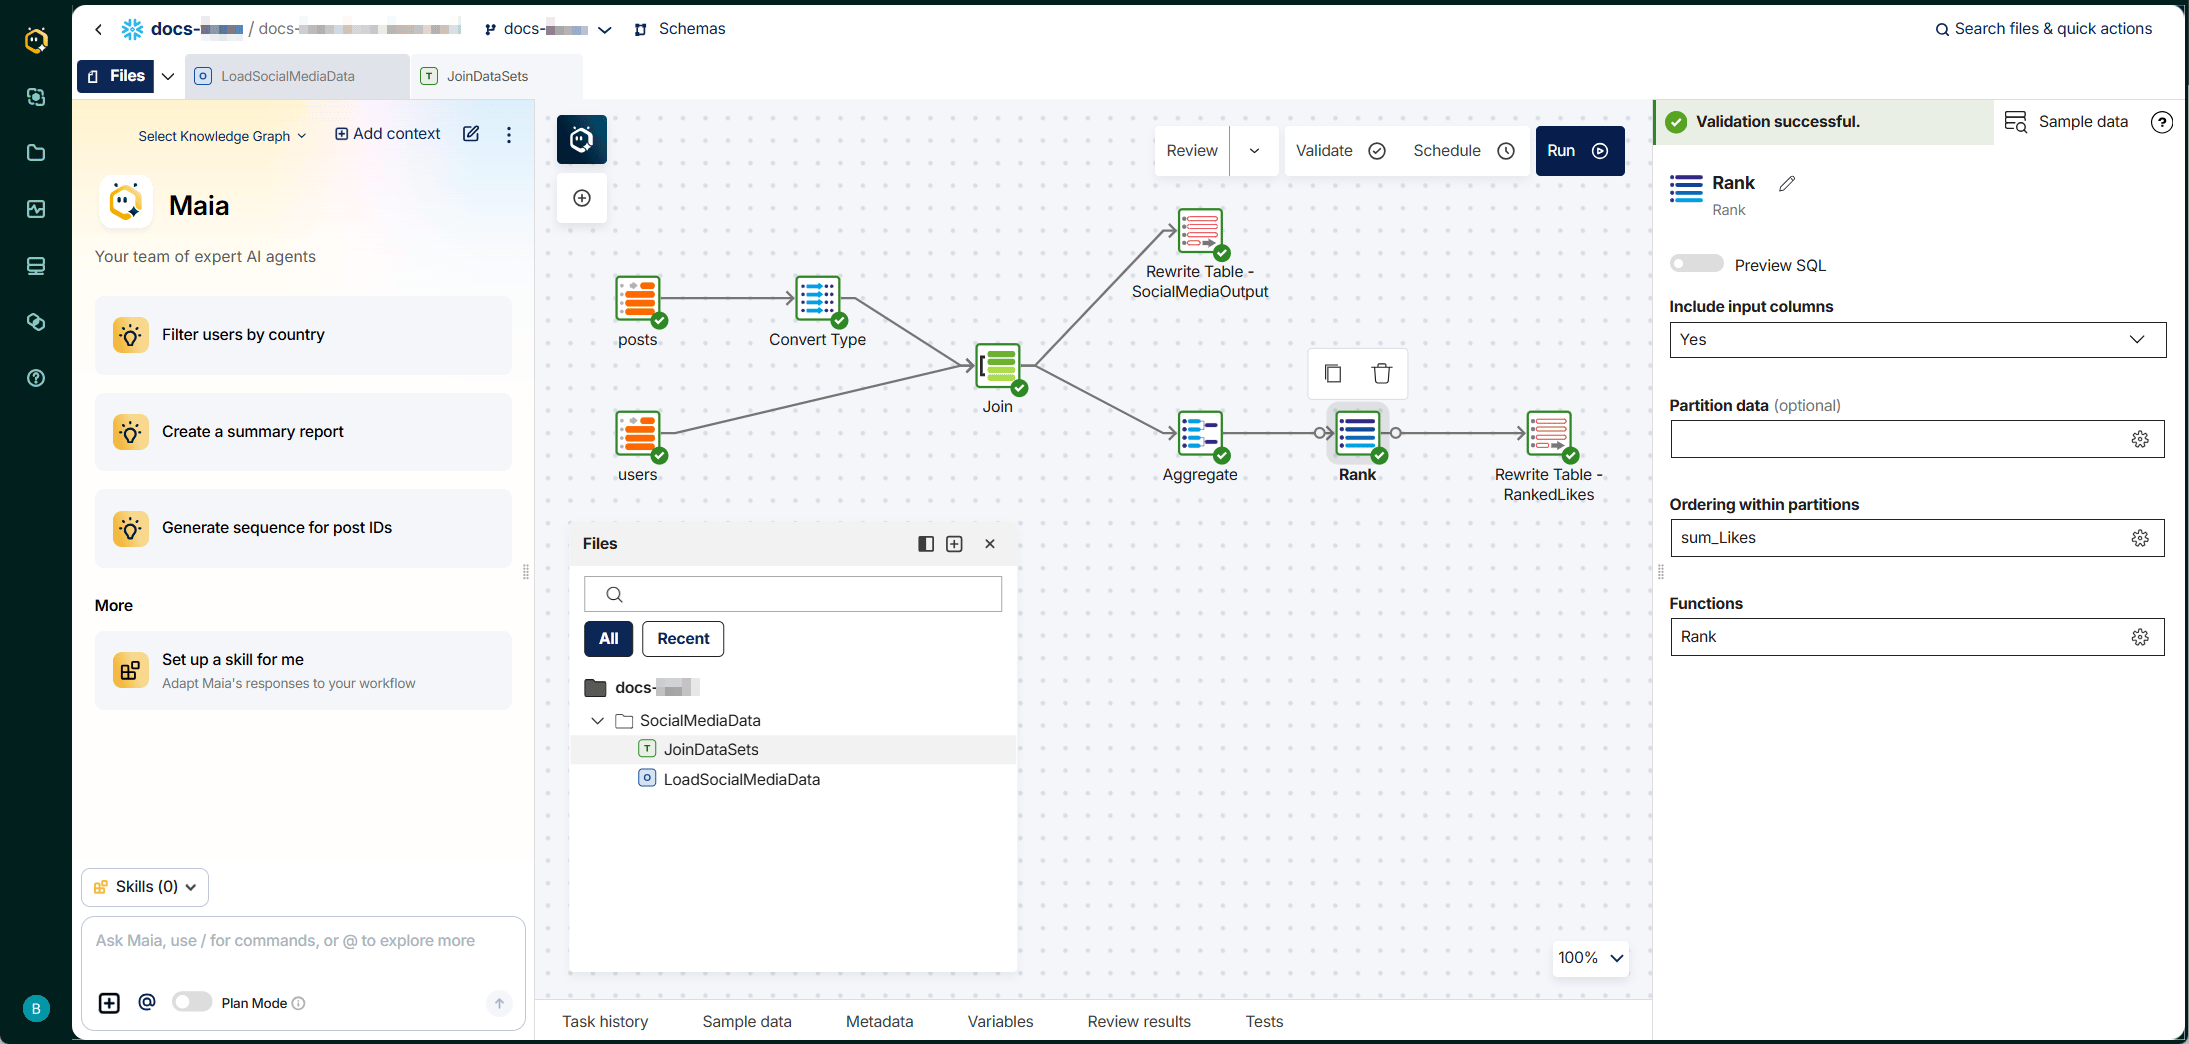
Project bar
The project bar is located above the canvas and contains the following:- Warehouse icon: An icon that indicates the data warehouse type used in your current project.
- Project name: The name of your current project. Click the project name to go back to the Branches list and configure project settings.
- Environment: A drop-down used to select the environment for your current session, for example when you run a pipeline or sample data. The drop-down lists every environment you have access to, and the branch’s default environment—if one is set—is marked with a Default badge. If no environment is selected, select one from the drop-down. Switching environment here applies only to your current session; to change the branch’s default environment, use the Branches tab.
- Branch name: The name of your current branch. Click the branch name to open a drop-down menu with available Git actions.
- Schemas: Click to open the Schemas panel, which displays the tables and views in your environment’s default database. In this panel, you can:
- Use the drop-down at the top of the panel to view the tables and views in a different database.
- If you have a transformation pipeline open, click Inspect data next to the name of a table or view to open the Warehouse data dialog, which lets you add warehouse data to a pipeline.
- Files: Click Files to open the Files panel, or click the down arrow next to Files to add or import a file to your current branch.
Click the Dock to left/Undock into separate window icon in the top right corner of the Schemas or Files panel to dock or undock it on the left of the canvas.When undocked, these panels can be positioned anywhere on the canvas–for example, the Files panel in the image.
Elements on the canvas
- : Click the logo on the canvas to chat with , your agentic data team.
- Add component: Click to open the Add component dialog, where you can:
- Search, filter and view the components that can be used in the current pipeline.
- Click the Warehouse data tab to add data from your warehouse to the pipeline.
- Click Add custom connector to create a custom connector to fetch data from a REST API of your choice.
- Review: Click to check whether your pipeline meets a set of predefined rules. Click the down arrow next to Review to open pipeline review options. For more information, read Reviewing pipeline quality.
- Validate: Click to check whether the pipeline configuration is valid without consuming credits or performing actions on your data. For more information, read Validating pipelines.
- Schedule: Click to schedule the current pipeline to run automatically at a set interval. For more information, read Schedules.
- Run: Click to run the current pipeline once.
Tabs below the canvas
- Task history: After validating or running a pipeline, use this tab to view its task history, which shows whether the task succeeded or failed, and lets you view more details about pipeline runs.
- Sample data: Select a validated component and use the Sample data tab to sample its output.
- Metadata: Select a validated component and use the Metadata tab to view the metadata of the data output by a component.
- Variables: Use this tab to create, search for and manage pipeline and project variables. For more information, read Project and pipeline variables.
- Review results: After clicking the Review button on the canvas, use this tab to see the results of the pipeline quality review.
- Tests: Use this tab to create and view all the tests associated with the current pipeline.
Component properties
When you select a component on the canvas, the Properties panel appears on the right of the canvas. This is where you configure the component’s properties so that it collects, transforms, and/or unloads your data exactly how you want it to. For more details about this panel, read Component properties. For information about configuring the properties of a specific component, read the component’s guide in the page in the Components section of our documentation.Files panel
The Files panel lists every pipeline you have created on your current branch. Icons identify the type of pipeline–a blueO for orchestration, a green T for transformation, or a purple flask icon for test pipelines. Pipelines can be organized into folders within the panel. Click Files in the top-left of the canvas to open this panel. If you have any files open, the Files button appears to the left of the tabs. You can also search for files using the search bar in this panel.
Click and drag the header of the Files panel to move it around the canvas, or click the Dock to left icon to dock it on the left of the canvas. If you use this option to dock the Files panel, the Schemas panel will also be docked. To undock the panel, click the icon again.
In this panel, you can add, delete, or edit pipelines. Read Pipelines for a full description of how to manage pipelines and use them in data workflows.
Our Pipelines tutorial is a step-by-step walkthrough that explains how to create an orchestration pipeline and a transformation pipeline using sample data provided by Matillion. This guide may be useful if you are new to Designer and want to practice creating pipelines and configuring components.
Uncommitted change indicators
The Files panel displays indicators next to the name of a pipeline if it has uncommitted changes:- N – The pipeline is new.
- M – The pipeline has been modified.
- R – The pipeline has been renamed but no other changes have been made.
Deleted pipelines won’t be displayed in the Files panel but will be listed in the Changes table in the Commit dialog.
Task history tab
Tasks are created whenever an orchestration or transformation operation is performed. This includes pipelines that you run manually, scheduled pipeline runs, and pipeline validation. The Task history tab at the bottom of the canvas shows a list of all completed, running, queued, cancelled, and failed tasks. Double-click a Run task to see more details about the selected task. Each row in the task history tab shows the following basic information about the task:- Status icon:
- Red warning: The task has failed to complete.
- Green checkmark: The task has completed successfully.
- Loading dots: The task is currently in progress.
- Hourglass: The task has been queued.
- Task: The type of task: Validate or Run.
- Environment: The environment that the task was performed in.
- Pipeline: The name of the pipeline that the task relates to.
- Queued: The time of day (hour:minute:second) that the task was queued for execution. This is not the same as the time the task execution started.
- Completed: The time of day (hour:minute:second) that the task execution completed, either successfully or unsuccessfully.
To cancel a running pipeline, read Cancelling a running pipeline in Managing Pipelines.
Detailed task history
To view further details about a Run task, double-click it in the Task history tab. This will open a new tab in . In the top right, you can see when the task started, when it completed, and how long it took to finish. While a task is running, this tab updates to show the progress of each step in the task. After the task is completed, this tab displays full details about each step in the task. You can expand some rows in the task to view more details about subtasks. The task history shows:- Pipeline: The name of the pipeline.
- Component: The name of each component in the task.
- Started: The time of day (hour:minute:second) that the task execution began. This time is shown for the entire task, not for each individual component.
- Duration & Completed: The time, in seconds, that the task took to execute, and the time of day (hour:minute:second) at which the task completed. This time is shown for the entire task, not for each individual component.
- Row Count: Where applicable, the number of rows of data processed by the task.
- Message: A message returned by each component when the task runs. This will indicate the success of the task, or give error information if the task failed.
Logging
To view detailed log information about a task, double-click it in the Task history tab, then click Logging in the new tab. The Logging tab shows the progress of the selected task step by step, and includes messages relevant to each step of the process. The log updates in real time as the task is running. The information shown here includes SQL code generated as part of the task, details of warehouses and s involved in the task, as well as extremely detailed information that can be used to debug any pipeline issues. The Logging tab doesn’t include IP address information for the .Canvas notes
You can add notes to the canvas. These have no effect on the design or operation of the pipeline, but can be used to provide information for other users, such as the purpose of the pipeline. Notes are text boxes with a solid outline, which appear behind components on the canvas. There are two types of notes:- Text note: A freeform text box you write manually. To add a text note, right-click on the canvas, and select Add note from the context menu.
- note: An AI-generated note about specific components, created by . To add a note, right-click a component (or multiple components) and select Add note using Maia. For more details, read Pipeline notes.
- Edit the note text: Click in the center of the text box to enter and edit the content of the note. Text is aligned to the top-left of the box. To write text on multiple lines, insert two line breaks (press
Entertwice) where you want a blank line to appear between paragraphs. You can format the text using common Markdown formatting. See this Markdown reference for details. - Resize the note: Click and drag the border of the text box.
- Reposition the note on the canvas: Click and hold the ::::: in the note header, then drag to move the note.
- Change the color of the note: Click the note, then click the Color icon in the action bar and select a color.
- Copy the note: Click the note, then click the Copy icon in the action bar.
- Delete the note: Click the note, then click the Delete icon in the action bar.